

Milk Cohort analysis
What this page helps you do
Section titled “What this page helps you do”Cohort analysis compares milk performance for groups of animals over a lactation period. Use the curve and summary together to understand production patterns without mistaking a partial group for the whole herd.
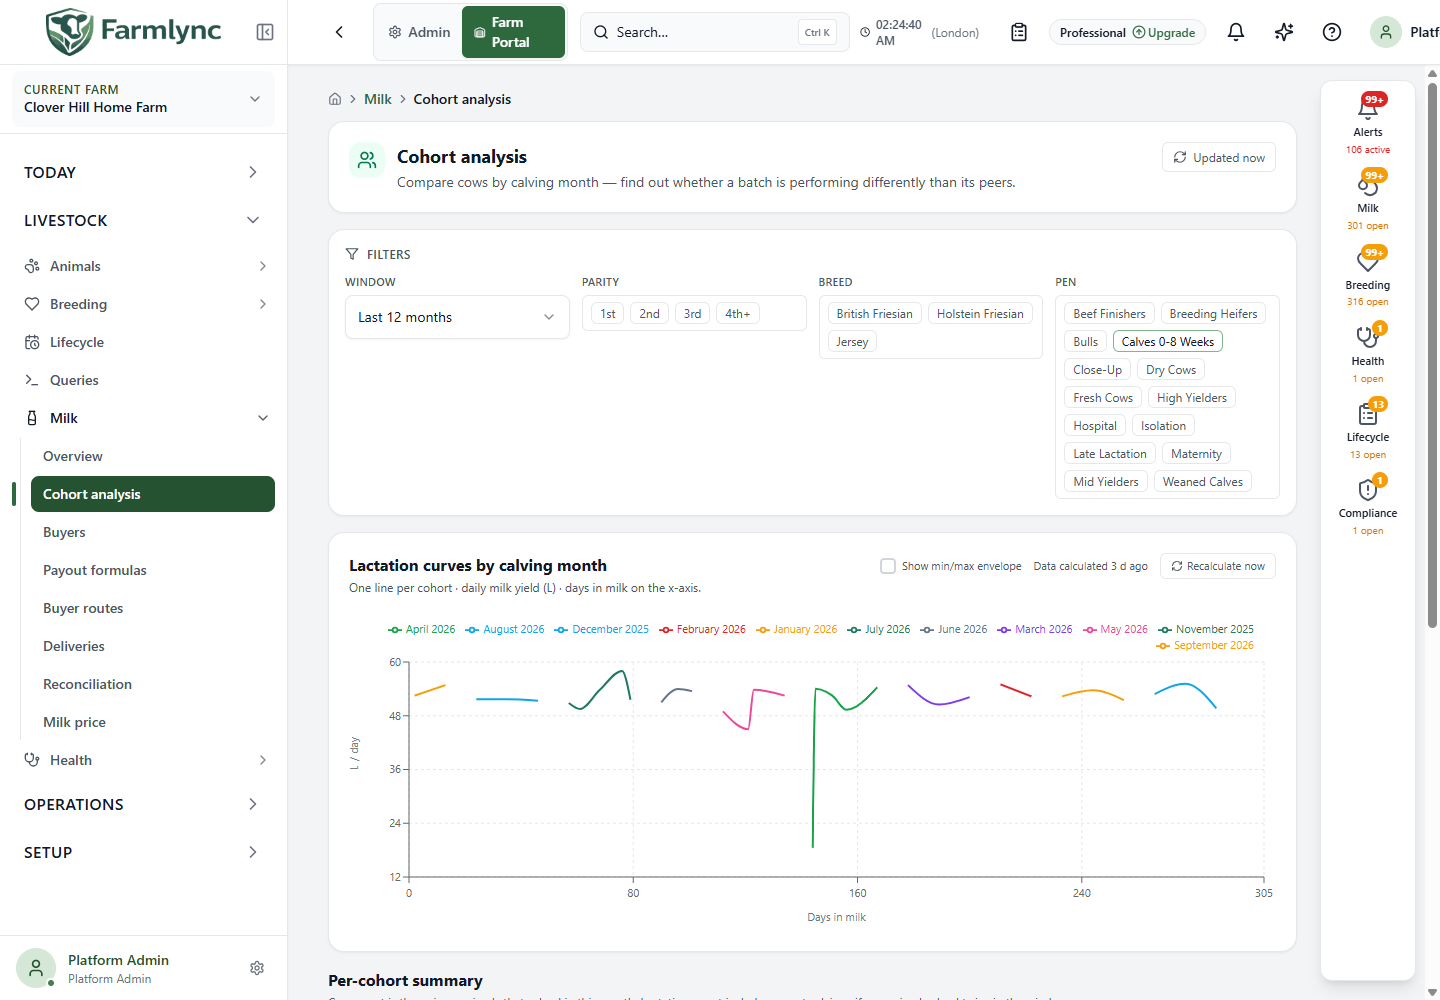
Open Milk → Cohort analysis. A cohort is a group of lactations that started in the same calendar month. The page helps answer questions such as “How do our September calvers compare with August calvers at the same stage of lactation?”
This is a dairy workflow. It requires the appropriate analytics access and subscription feature; a beef-only farm shows an explanatory message instead.
Set the filters
Section titled “Set the filters”| Control | Values and effect |
|---|---|
| Window | Last 3, 6, 12 or 24 months; starts at 12. Selects calving/lactation-start month cohorts, rather than restricting every milk record to that many recent months. The cutoff month is included in full, so the chart can contain the current month plus the preceding N month labels. |
| Parity | Select one or more offered lactation-number chips: 1st, 2nd, 3rd and the currently labelled 4th+ control. No selected chips means all. See the limitation below. |
| Breed | Select one or more breeds present in the available cohort data. No selection means all. |
| Pen | Select one or more farm pens. The cohort data associates pen with the animal’s residency at lactation start, not simply its pen today. |
| Clear all | Removes parity, breed and pen selections. It leaves the chosen Window unchanged. |
| Refresh in page heading | Retrieves the current calculated results. It does not itself rebuild the underlying cohort calculation. |
Filters combine: selecting first parity and a breed shows first-parity lactations of that breed. Clicking an active chip removes that choice. Narrowing filters reduces sample sizes, so compare the Cows and Lactations counts as well as the chart.
Current parity-filter limitation: although the fourth option is labelled 4th+, the current request and read filter select lactation number 4 exactly. Do not use it as an all-older-cows selection; fifth and later lactations are included when parity is left unfiltered.
Read the lactation curves
Section titled “Read the lactation curves”- The horizontal axis is Days in milk, from 0 to 305. This aligns lactation stage across cohorts; it is not a calendar-date axis.
- The vertical axis is daily milk quantity in the organisation’s display unit. The axis and tooltip identify that unit.
- Each coloured line represents a calving-month cohort. Match it to the legend and the coloured dot in the summary table.
- A plotted point is the average recorded daily quantity among the contributing lactations at that DIM. Session quantities on the same DIM are combined first.
- Hover over the chart to see DIM and the cohort values at that position.
The line connects available points, including across gaps. A smooth line does not prove milk was recorded on every intervening day. The number of contributing lactations can also change along the curve: recent calvers have not reached late DIM, and some records may be missing.
Colour repeats when there are more cohorts than palette colours. Use the legend labels and hover values rather than colour alone, or choose a smaller window.
Show min/max envelope
Section titled “Show min/max envelope”Turn on Show min/max envelope to add a shaded range for each cohort. At each available DIM, it extends from the lowest to the highest contributing daily yield.
This is the observed range, not a confidence interval or a statistical significance test. A wide range can indicate substantial variation within a cohort or a small number of unusual records. Check data quality and animal-level records before deciding that an entire calving group performs poorly.
Read the per-cohort summary
Section titled “Read the per-cohort summary”| Column | Meaning |
|---|---|
| Cohort | The lactation-start month. Its coloured dot matches the chart. |
| Cows | Distinct animals represented in the cohort result. |
| Lactations | Number of included lactations; this can differ from animal count. |
| 305d avg | Average of the available per-lactation quantities used for this summary. See the calculation distinction below. |
| 305d min / max | Lowest and highest of those per-lactation quantities. These are not the daily envelope limits. |
Table sorting does not change a cohort’s colour in the chart. A dash indicates that the value is unavailable, not a measured zero.
Why a filtered 305d figure can differ
Section titled “Why a filtered 305d figure can differ”With no parity, breed or pen filter, the summary uses a positive projected 305-day total where available; otherwise it uses the positive observed yield within DIM 0–305. Lactations without either quantity do not contribute to that yield average.
With any of those filters selected, the summary is calculated from the matching observed daily points within DIM 0–305. It does not use the same projected-total fallback. Lactations with no matching recorded points are also absent from this filtered result.
Consequently, filtering can change both the population and the calculation basis. A young cohort’s observed-to-date total is not a completed 305-day yield. Compare cohorts at similar maturity and with similar record completeness; do not treat a drop after applying a filter as proof of poorer performance on its own.
Refresh and Recalculate now
Section titled “Refresh and Recalculate now”Refresh fetches the results already available. Recalculate now queues background recalculation from current source records; its spinner covers submission of that request, not completion of the rebuild. The request can therefore finish before the new result is ready. It does not edit individual milk records.
After an import or correction, request recalculation once, allow time for it to finish, then refresh. Repeated clicks are not a way to guarantee immediate completion. If results remain unchanged unexpectedly, check the source records and ask an administrator to investigate the calculation status.
The Data calculated … label reflects a timestamp on stored result data. It is not proof of the last successful background check: a check that finds no data changes can leave that timestamp unchanged. The backend reports whether calculation is current, pending or blocked, but the current page does not display that state. The existing tooltip’s fixed “every 4 hours” wording should not be used as a freshness guarantee.
Worked comparison
Section titled “Worked comparison”Choose a 6-month window and compare first-parity animals of one breed. At DIM 60, inspect each month’s average and enable the range envelope. If one line is lower, check the cohort size, recording gaps and individual records. Keep the same filters while comparing; changing filters can change the summary basis as well as the animal population.
If the page says No cohorts in this window, widen the window or clear filters. If it reports a loading error, use retry; an error is not evidence that the farm has no milk data.