

Feed variance
What this page helps you do
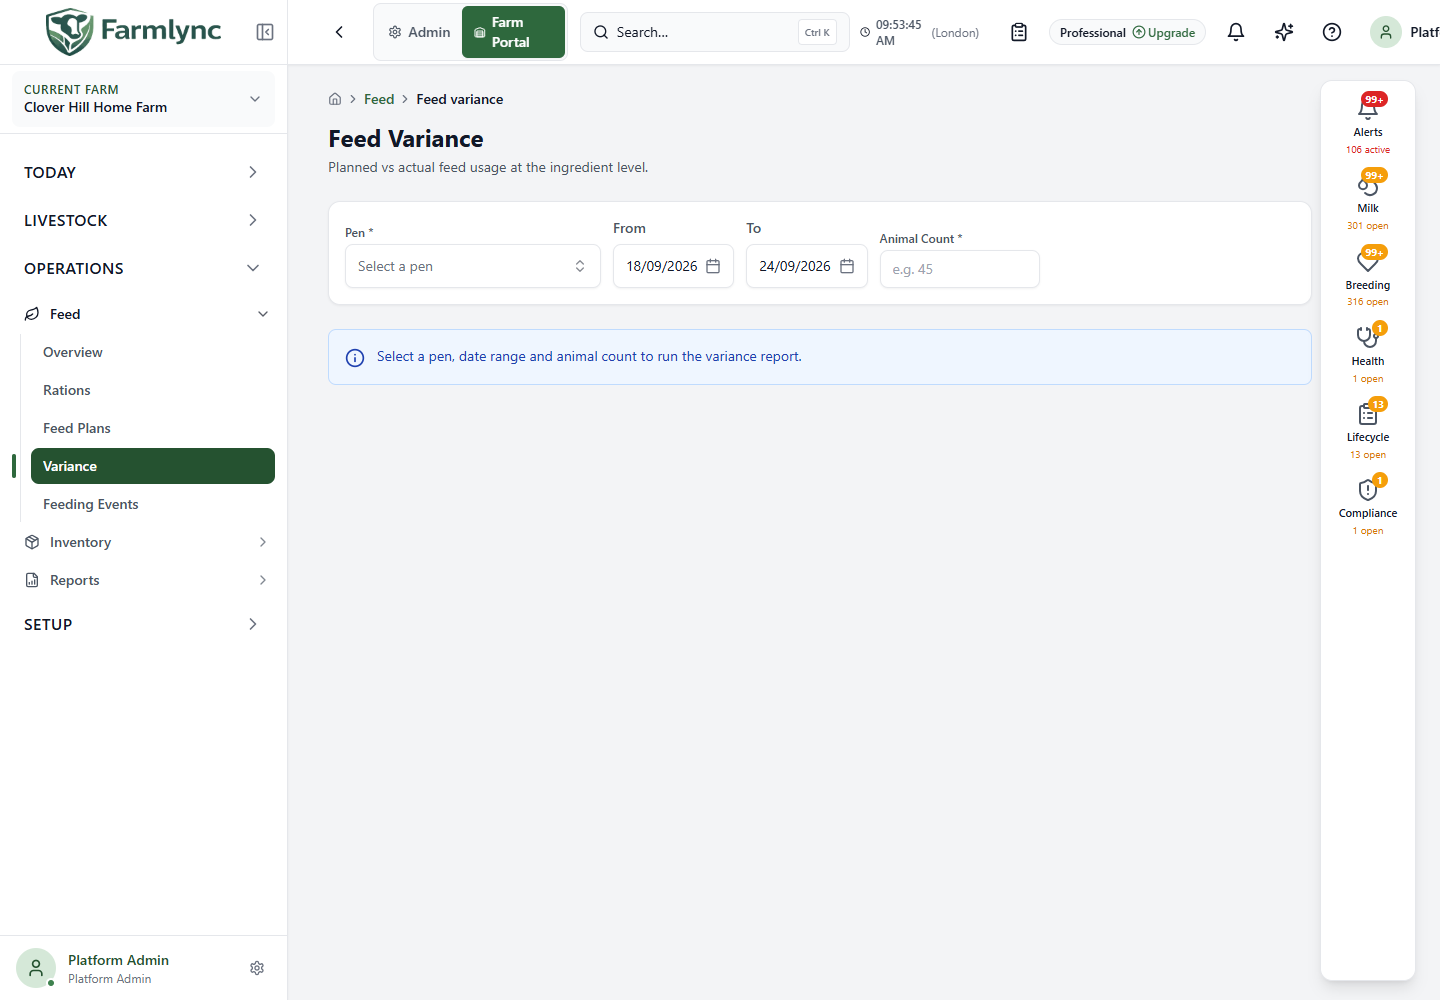
Section titled “What this page helps you do”Operations → Feed → Variance compares what one physical pen was planned to receive with what its feeding records say was actually offered and retained. Use it to investigate delivery, refusal, recording, ingredient or cost differences before changing a ration or plan.
This is a read-only analysis. It does not alter a plan, feeding event or inventory balance.
Run the comparison
Section titled “Run the comparison”The report waits until every required input is present.
| Control | Accepted value and effect |
|---|---|
| Pen * | Required physical pen. Search the farm’s pen list. A logical animal group is not interchangeable with a pen. |
| From | Required farm-local first day; defaults to six days before today. |
| To | Required farm-local final day; defaults to today. It must be the same as or later than From. |
| Animal Count * | Positive whole number representing the animals for which the planned ration should be calculated. The page does not derive this from pen membership. |
The selected range includes both end dates and can cover at most 365 days. Filters are stored in the URL, so a copied link preserves the selected pen, dates and animal count for another authorised user.
Choose an Animal Count that represents the planned feeding basis for the period. If pen numbers changed materially, run shorter date windows with the relevant count rather than using one misleading average.
Understand the covered days
Section titled “Understand the covered days”For each selected day, Farmlync finds the feed plan that appears to have been in force for that pen. It consults retained plan history as well as the current plan row. That history is currently incomplete: some edits are not archived correctly, a deleted plan disappears from the report, and an archived plan still reads the referenced ration’s current recipe. Treat a historical planned value as operational guidance rather than immutable evidence until plan and ration versioning is completed.
Days Covered shows days with a plan / total days in range. A warning badge reports days without plan. Only covered days contribute to both planned and actual comparison values:
- planned amounts are calculated for covered days;
- feeding events on covered days contribute to Actual; and
- feeding events on days without a plan are excluded because there is no planned value to compare them with.
The service records how many events and kilograms were excluded outside plan coverage, but the current page does not display those two values. It can consequently show No feeding events in the selected range when events exist only on uncovered days. When days without plan is greater than zero, review Feeding Events for those dates before treating the summary or empty state as the total feeding for the selected range.
Read the summary
Section titled “Read the summary”| Tile or line | Meaning |
|---|---|
| Days Covered | Covered plan days compared with all selected calendar days. |
| Planned (kg) | Sum of ration ingredient kilograms per animal per day × entered Animal Count for covered days. |
| Actual (kg) | Recorded covered-day feeding quantity after subtracting recorded refusal. |
| Variance (kg) | Actual − Planned. Positive means more recorded than planned; negative means less. It does not by itself prove waste, shortage or a stock error. |
| Cost Variance | Actual cost − Planned cost from the priceable rows. Positive is shown red; negative green. A dash means no usable comparison was produced. A displayed amount can currently be partial when some planned or actual ingredients have no usable cost, so inspect every row before relying on the total. |
| Refusal logged | Covered feeding events with refusal explicitly recorded compared with covered events considered by the report. |
| Total refusal | Sum of recorded refusal kilograms on covered days. |
When events have no refusal value, Farmlync assumes zero waste for their Actual quantity and states how many events used that assumption. Treat a low refusal count as limited intake evidence rather than proof that animals consumed everything offered.
Read ingredient rows
Section titled “Read ingredient rows”The desktop table and mobile cards show one row per feed product found on the planned or actual side.
| Column | Meaning |
|---|---|
| Feed | Farm stock product name and its saved unit. A deleted/unresolved item can appear as an unknown or deleted stock item. |
| Planned (kg) | Covered-day planned ingredient quantity after multiplying by Animal Count. |
| Actual (kg) | Covered-day effective recorded quantity attributed to this ingredient. |
| Variance (kg) | Actual − Planned, with + for over plan. |
| Variance % | (Actual − Planned) ÷ Planned × 100. A dash means Planned is zero, so a percentage is undefined. |
| Planned Cost | Planned kilograms × the product’s currently available cost per kg. This is not a price snapshot from the plan date. |
| Actual Cost | Recorded effective kilograms × a usable cost per kg. Direct-feed events can use their saved event rate; ration ingredient rows use the product’s current cost because no ingredient-price snapshot is stored. |
| Cost Variance | Actual Cost − Planned Cost when both sides can be calculated. |
Rows with the largest absolute percentage difference appear first. A row with zero planned quantity has no percentage and may appear before percentage-ranked rows; read its kilograms rather than treating the missing percentage as low variance.
Percentage badges are presentation bands:
- under 5% absolute variance — green;
- 5% through 15% — amber; and
- over 15% — red.
These are attention colours, not nutritional or financial approval thresholds.
How actual ration ingredients are attributed
Section titled “How actual ration ingredients are attributed”For a ration-based feeding event, Farmlync normally uses the ingredient snapshot saved with that event. This keeps the historical ingredient split tied to what was recorded at the time. Refusal is event-level and is apportioned across its ingredient quantities.
If an older ration event has no saved ingredient snapshot, the report falls back to the current ration definition. The page states how many historical events used this current-ration fallback. Treat those ingredient rows as reconstructed evidence: later ration edits can affect the split used for those older events, even though the event’s total quantity remains recorded.
Direct single-feed events use their saved stock product directly.
Understand cost availability
Section titled “Understand cost availability”Cost comparison requires a price that can be normalized to kilograms. Farmlync can derive per-kilogram cost from products priced in kilograms and tonnes. Products priced in units such as bales or litres need an explicit compatible event cost or conversion evidence; otherwise the affected cost cells show a dash.
For ration events, Farmlync prices each ingredient with its own current product cost rather than applying the ration’s blended rate to every ingredient. Changing a product price can therefore change a historical variance report. The summary also adds the rows that can be priced and does not currently mark the result as partial when other positive-quantity rows are unpriced. Review the dashes in both cost columns before using the total for a financial decision.
Investigate a difference
Section titled “Investigate a difference”- Confirm the physical Pen, dates and manually entered Animal Count.
- Check Days Covered. For missing days, inspect Feed Plans and determine whether the pen genuinely had no plan.
- Inspect Feeding Events for missing, voided, duplicate or wrongly timed records, especially on uncovered days.
- Check refusal coverage. Missing refusal is treated as zero, which can overstate assumed intake.
- Open the ration and verify ingredient kilograms and feed-product mapping.
- Check inventory product units and cost evidence for any dashes in the cost columns. A displayed summary cost can still be partial.
- If the page reports current-ration fallback, treat those historical ingredient allocations with care.
- Correct the real plan, event, product or cost record. Do not invent a balancing feeding event solely to make the variance zero.
Empty and error states
Section titled “Empty and error states”If there are no rows, the page says No feeding events in the selected range. Confirm the pen and dates, then inspect Feeding Events. If a plan exists but no qualifying actual event was recorded, planned-only ingredient rows can still appear; therefore an entirely empty result usually means there is no comparable feed evidence for that selection.
Use Try again after a load failure. On a touch device, pull to refresh reloads the variance query without changing its URL filters.