

Breeding analytics — interpret fertility charts
What this page helps you do
Section titled “What this page helps you do”Livestock → Breeding → Analytics helps you distinguish a herd-wide fertility pattern from a small group of cows needing attention. It reads recorded heats, services, pregnancy outcomes and calvings; changing a view or chart does not record a breeding event. Use Operations at the top to return to the operational Breeding overview, and use the worklist to act on a due task. Access depends on the farm’s plan and analytics permission.
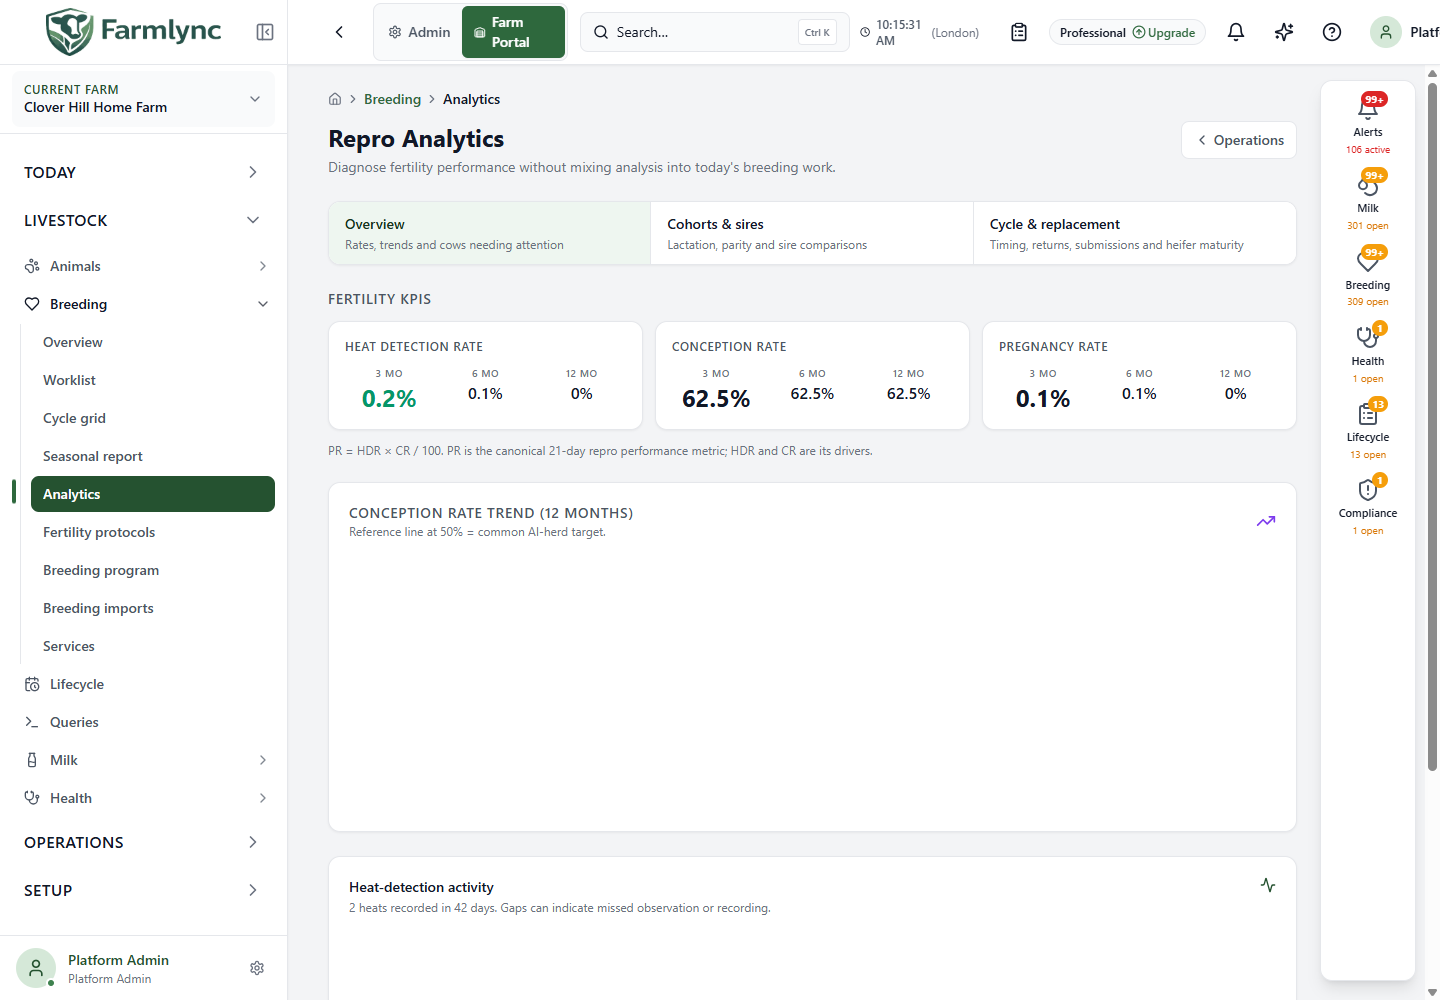
Choose Overview, Cohorts & sires, or Cycle & replacement. Fertility KPIs appear above the view-specific panels in all three views. A dash or empty panel means the required dated evidence is unavailable; it does not mean a measured zero. If a panel fails to load, its Retry control requests that panel again.
Fertility KPIs — all views
Section titled “Fertility KPIs — all views”The Heat Detection Rate, Conception Rate, and Pregnancy Rate cards each compare the trailing 3, 6 and 12 months up to the time the page is loaded. They are separate rolling windows, not three points on a single chart. Read sample counts and outcomes before comparing percentages between farms or periods.
| Measure | What it represents |
|---|---|
| Heat Detection Rate (HDR) | Heats observed compared with expected heats for the page’s current eligibility roster. That roster currently includes active, in-program, non-pregnant females with no stored hold reason; a cow must be beyond the farm’s voluntary waiting period, while a never-calved female is included immediately. Expected heats = eligible females × window days ÷ 21 days; the result is capped at 100%. |
| Conception Rate (CR) | Services with a recorded conception outcome divided by resolved services. A service that conceived and was followed by early loss still counts as a conception; assess loss separately. |
| Pregnancy Rate (PR) | The displayed composite is HDR × CR ÷ 100, not a second independent count of pregnancy checks. |
The denominator for rolling HDR uses the current roster for every window. It is narrower than the full readiness decision used before recording a service: it does not currently apply Do not breed, lifecycle-stage, heifer age/weight, an animal-specific waiting-period override or an expired hold date, and it uses 21 days rather than the farm’s configured cycle interval. Treat HDR as a directional recorded-observation indicator until those rules are aligned. If farm membership, holds or pregnancy status has changed, comparisons with old periods are not a frozen historical-cohort study.
The separate Conception rate to first service card on Overview appears when a resolved first service after calving exists. A first service counts as successful when it has a conception outcome, including a later early loss. A failed result or a later re-service makes the first service a resolved failure; a final Pending service is excluded. The card shows the resolved sample size.
Overview — trend, risk and recorded heats
Section titled “Overview — trend, risk and recorded heats”Conception rate trend (12 months) plots each farm-local month’s conceived services divided by conceived-plus-failed services. Empty months remain on the axis but have no rate. The dotted 50% line is a reference target, not a pass/fail rule. Hover a month to read its rate, number of services and any early losses among conceptions. A rise in conception alongside rising early loss needs a different investigation from failure to conceive.
Conception-risk worklist appears when cows meet its risk threshold. The header gives the total flagged and threshold; the table shows the highest-scored cows with Cow, Score and Top factor. The panel requests at most ten rows, so “+ more flagged” means the table is not the full list. Select the cow identity to open her record. Score colours indicate urgency bands; they are screening aids, not diagnoses. If none qualify, the page says so.
Heat-detection activity charts recorded heats on each farm-local day in the last 42 days. A gap is a gap in recorded observations, not proof that no heats occurred. Hover a bar for its day and count; select a non-empty bar to open the animals with recorded heat that day. Select an animal in the slide-over to inspect its record.
Cohorts & sires — compare like with like
Section titled “Cohorts & sires — compare like with like”KPIs by lactation lists the number of calving-to-first-service observations, average elapsed days from calving to first service, average elapsed days to the first service recorded as Conceived, overall conception rate and first-service conception rate per lactation row. The screen labels the observation count Cows. A dash signals insufficient dated evidence. Use that count before treating a low-volume row as a trend.
Herd by parity counts females by known lifetime lactation number; incomplete history stays Unknown. Select a non-empty band for its animals. Calving index by parity shows average completed calving intervals for each lactation cohort against a 365-day planning target. It excludes possible intervals where lifetime parity history is incomplete and reports that count. Select a non-empty band for its animals. These panels have different denominators: one is herd composition, the other needs consecutive calvings.
Calving interval by cow has two switches:
| Switch | How to use it |
|---|---|
| Heading long | Default. Cows still between calvings, with last calving, days since, pregnancy status and Projected interval. An n d+ value is a best-case lower bound, not a confirmed future calving date. |
| Completed | Cows with recorded intervals; compare latest interval, her average over available intervals, parity and latest calving. |
The panel gives a herd average and target when available. Green is at or below target, amber up to about 10% over, and red further over. It also reports incomplete-history exclusions. Select a cow identity to inspect her breeding and calving history. Both tables show 20 rows per client page.
Services per conception uses Group by: Sire, Breed, Season, or Lactation. The window begins on the farm-local date exactly 12 calendar months before today. Each bar sums the number of services in cycles that reached conception, then divides by those conception events in that cohort. The dashed line uses those same service and conception totals across all displayed cohorts; it is not an average of bar heights. Hover for the cohort rate and conception count. Lower bars mean fewer services per conception, but do not compare a tiny group with a large one as though their evidence were equal. Lactation is the number of recorded calvings before conception. Season uses the conception’s farm-local date and the fixed Northern Hemisphere groups Spring (March–May), Summer (June–August), Autumn (September–November) and Winter (December–February); it is not yet adjusted for Southern Hemisphere or tropical production seasons.
Sire performance (last 12 months) covers the last 365 farm-local days and excludes services with no sire name. It displays up to the ten most-used named sires, ordered first by service count and then by conception rate; it is not a ranking of every sire from highest conception rate. Only sires with a resolved conception rate produce a bar. Hover for the rate, number of all services and, where present, early-loss rate. Colours are visual ranges; consider resolved sample volume and losses before changing sire policy. The current sire bar chart has no animal drill-down action. Use service and animal records for case-level evidence.
Cycle & replacement — timing and returns
Section titled “Cycle & replacement — timing and returns”Insemination CuSum plots cumulative observed minus a 40% target for resolved services from the first day of the current farm-local month and the preceding 11 calendar months. Conceived and Early Loss both count as an insemination that took; Failed subtracts from the cumulative score. A falling line indicates results below that target. The dashed ±2σ bands are binomial control references, not a veterinary diagnosis. Hover a service date for the cumulative value and limits. At least three resolved services are needed for a plotted line.
Days to first service — distribution is based on calving-to-first-service intervals. The blue box spans the 25th to 75th percentiles, the dark tick is the median, and the amber tick is the 90th percentile. The card shows sample n; with fewer than three first-service calvings it shows an insufficient-data message instead. A long right tail can matter even when the median looks acceptable.
Returns & cycle analysis (12 months) combines two measures. Non-return rate @ 21d is the share of qualifying services with no recorded return heat/service 18–24 days later; only services old enough to observe the full 24-day window qualify. It is not a confirmed-pregnancy rate. The adjacent histogram counts gaps between consecutive recorded oestrus events; green bands mark 18–24 days. Hover a bar for gap band and count. Missing observations and recording errors can alter the pattern, so confirm individual cases before acting.
Age at first calving needs a confirmed first lifetime calving and birth date. It shows average, median, cow count and age-band counts, plus up to eight animals recorded at 27 months or older. It reports exclusions when lifetime history or birth date is incomplete. The age bands are context for rearing performance, not clickable animal lists here.
21-day submission periods needs a Mating start date. Choose a farm-local date to generate up to six successive 21-day rows from that start; the first period does not appear before it begins. Columns are period, dates, Eligible, Submitted, Submission %, Conceived and Conception %. Submission % = submitted ÷ eligible; conception % = conceived ÷ submitted, with a dash for a zero denominator. The displayed first-period target is 90%. This table uses the selected mating start only; it does not set the farm’s breeding programme date.
The current denominator includes active, in-program females with no stored hold reason. Cows enter a period when the farm or animal-specific waiting period ends by that period’s scheduled final day; maiden heifers enter when the shared default breeding age is reached by that final day. A Conceived service before the period removes the animal from later denominators. For this table only, Early Loss does not count as Conceived. Do not breed, target weight, a farm-specific heifer age and an expired temporary hold are not currently applied. The current, partly elapsed period is also calculated against its full scheduled end date, so use completed periods for a fair submission-rate comparison.
For an actual seasonal block, use the Seasonal report, which has its own eligibility and period definitions. For any animal behind a selected heat, parity or calving-index band, open the chart’s slide-over and then the animal record to verify the underlying events.