

Feed overview
Purpose of this page
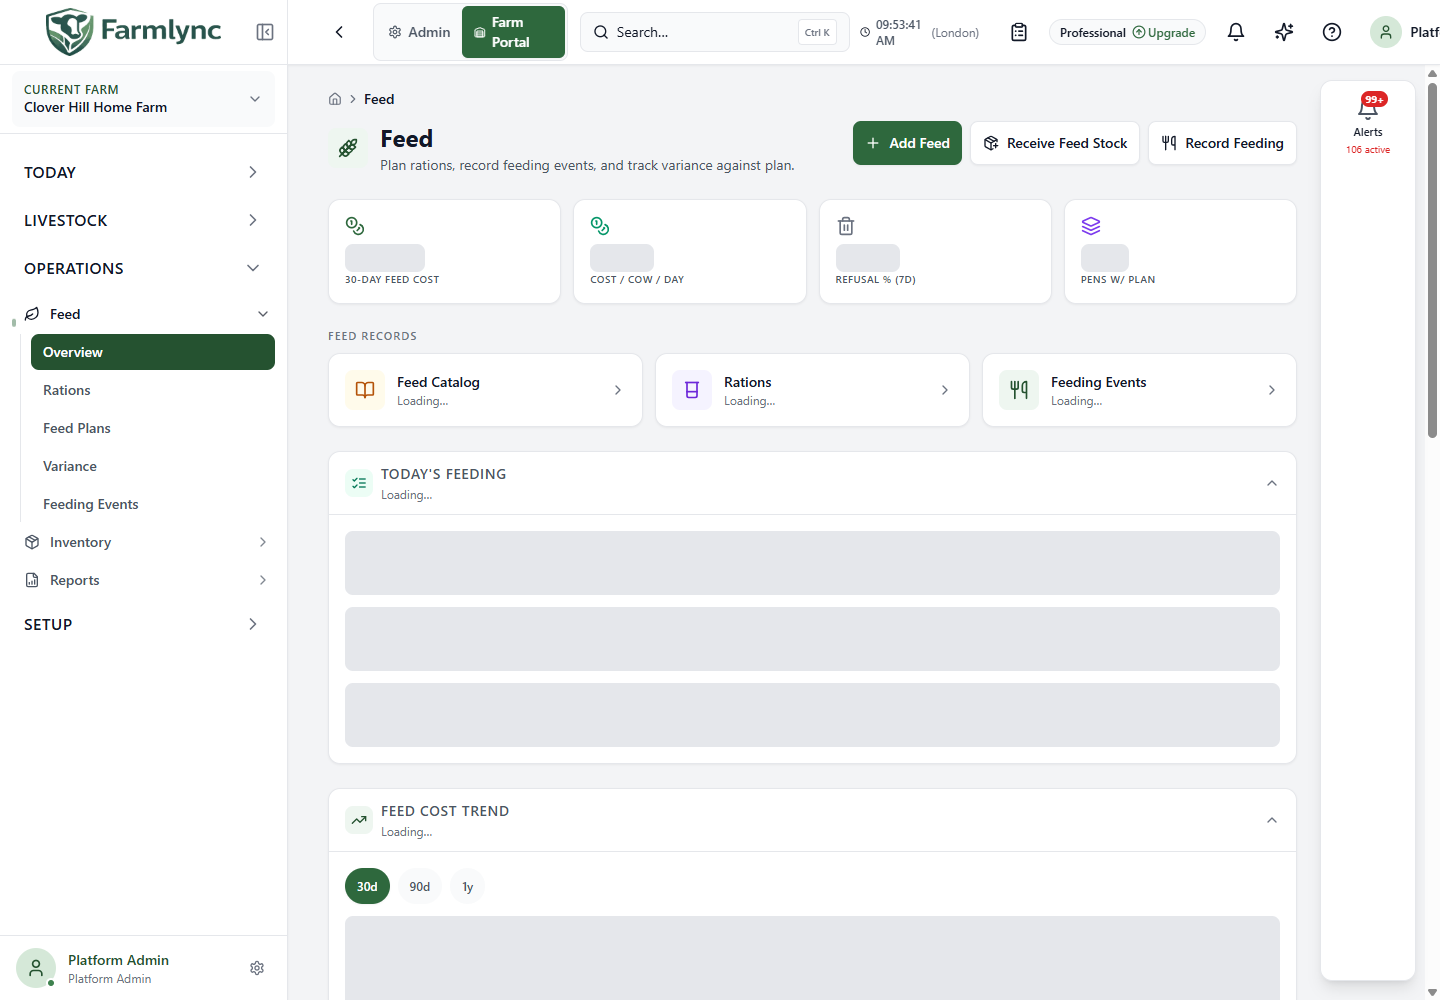
Section titled “Purpose of this page”The Feed overview is the daily control page for feeding work. It brings together what the farm planned to feed, what workers recorded, what that feeding cost, how closely each pen followed its plan and how long the recorded feed stock may last.
Use this page at the start and end of the feeding day:
- check Today’s feeding for pens that are still below plan;
- review active feed alerts and short stock cover;
- record or correct the feeding activity on the specialist pages; and
- return to confirm that the actual quantities, adherence and costs now reflect the work.
A feed product must exist in the farm’s feed catalogue before it can be added to a ration or recorded as a direct feed. A ration is a recipe. A feed plan assigns a ration to a physical pen for a date range. A plan defines expected work but does not create a feeding event automatically.
Before you use the overview
Section titled “Before you use the overview”- Select the correct farm from the farm selector. Every value on this page belongs to that farm.
- The farm’s subscription must include Feed management. Without it, the page shows an upgrade card and does not request feed data. Animal, milk and health records are unaffected.
- You need permission to view feed data. Actions are also limited by your current farm permissions and by support-session rules.
- Dates such as “today”, seven days and 30 days use the selected farm’s timezone.
Page header and actions
Section titled “Page header and actions”Open Operations → Feed → Overview.
| Control | What it does |
|---|---|
| Add Feed | Opens the feed catalogue, where an authorized user can add a new feed item. |
| Receive Feed Stock | Opens a stock receipt restricted to the Feed inventory category. It increases stock only after the receipt is saved. This action is unavailable in a read-only support session. |
| Record Feeding | Opens the Feeding Events page to record or review actual feeding work. |
| Pull down to refresh | On touch devices, refreshes all Feed overview queries together. |
On a phone, use the floating + button. Depending on your permissions, it offers Record Feeding, Batch Feeding, Receive Feed Stock and Add Feed. Batch Feeding opens the multi-animal or multi-pen recording flow without first leaving the dashboard.
Active feed alerts
Section titled “Active feed alerts”When the farm has active alerts in the Feed category, a red alert banner appears below the page header. It shows the number of active alerts and counts any critical or high alerts. Select the banner to open the Alerts page already filtered to active feed alerts.
The banner is deliberately hidden when there are no active feed alerts. A hidden banner means the alert service returned no current Feed-category alert; it does not replace a physical stock check.
Low-feed-stock alerts currently use the stock forecast. Future Feed-category evaluators will appear in the same banner automatically.
Headline measures
Section titled “Headline measures”The first four cards answer the questions most useful during daily feeding review.
| Card | Meaning |
|---|---|
| 30-day feed cost | Total calculated feed cost across the inclusive 30-farm-day window ending today. A dash is shown when no positive cost is available. |
| Cost / cow / day | A 30-day planning estimate. Farmlync divides the total cost of all recorded feeding events in the window by 30 and by the sum of each pen’s median recorded animal count. A dash means no usable pen headcount was recorded. Individual-animal events, and pen events without an animal count, still contribute cost but do not add animals to the denominator. Treat this as an indicative farm measure rather than an exact per-animal allocation. |
| Refusal % (7d) | Refused kilograms as a percentage of the quantity fed during the last seven farm days. The card also shows refused kilograms when that value is above zero. Above 5% is amber and above 10% is red. |
| Pens w/ plan | Number of physical pens covered by at least one active feed plan today. Use a low or unexpected count to find pens whose plans are missing or outside their effective dates. |
The cards are calculated from recorded data. They cannot account for feed delivered, wasted or refused without a corresponding Farmlync record.
Feed records shortcuts
Section titled “Feed records shortcuts”The Feed records row provides three navigation cards:
- Feed Catalog shows the number of feed catalogue items and opens the catalogue.
- Rations shows the number of saved ration recipes and opens the ration list.
- Feeding Events shows the number of events recorded in the last seven farm days and opens the event history.
Use these cards to investigate an unexpected dashboard value. The count cards are links; they are not editable dashboard fields.
Today’s feeding
Section titled “Today’s feeding”This expandable section acts as a live checklist for every active feed plan. It is open by default on a desktop and initially collapsed on a phone. It is hidden when the farm has no active feed plans.
The heading shows total actual / planned kg delivered and the resulting farm percentage. Progress is capped visually at 100%, even if more than the plan was recorded.
Each pen row shows:
- the pen name and current animal count;
- planned kilograms per animal;
- number of plan-matched feeding events recorded today;
- actual plan-matched kilograms against planned total kilograms; and
- a progress bar.
The progress bar is green when the plan quantity has been met, amber at 60–99% and red below 60%. The planned total is based on the active ration quantity and the pen’s animal count used by the schedule calculation.
Off-plan feeding
Section titled “Off-plan feeding”Feed given to a pen outside its active ration plan is shown separately as off-plan kg and an event count. It is intentionally excluded from plan progress and ration adherence. This lets you see that the pen received feed without falsely presenting an unplanned product as completion of the planned ration.
If a pen looks unfed even though work was done, check whether the event used the expected pen, ration, product, date and time. An off-plan line is a strong indication that the recorded event did not match the active plan.
Feed cost trend
Section titled “Feed cost trend”The Feed cost trend line chart turns the current cost card into a daily history. It is hidden when the selected period has no recorded cost.
- Choose 30d, 90d or 1y.
- The heading shows total cost and average cost per calendar day in the selected window.
- The vertical axis and tooltip use the organisation’s configured currency.
- Missing dates are represented by the daily-cost result so that the time axis remains continuous.
- Hover or tap a point to read the daily cost.
The chart reflects event quantities and usable feed costs. If quantities exist but the chart is absent or too low, confirm that the relevant catalogue items or ration ingredients have valid costs.
Feed events preserve the entered cost per kilogram and its source, but they do not preserve a separate currency code. Dashboard amounts are labelled using the organisation’s current currency setting; changing that setting does not convert historical amounts.
Adherence trend
Section titled “Adherence trend”The Adherence trend chart shows daily planned-versus-actual ration adherence. Choose 30d or 90d. Days without planned feeding are omitted from the average and chart.
The percentage is capped at 100%. Recording excess feed cannot improve adherence above the plan; overfeeding is treated as a separate operational issue. The dashed green line at 90% is the dashboard’s visual target. The heading shows the average percentage and number of planned days included.
Use the trend to identify sustained drift. A single low day may be a recording omission; repeated low days may indicate a plan, delivery or stock problem.
Cost by pen
Section titled “Cost by pen”The Cost by pen section shows feed-event cost for each pen across six calendar months: the current month and the preceding five months. It appears only when pen-level feeding events exist in that period.
On desktop, each row is a pen and each month is a column. The final column is the pen total, and the highest total appears first. On a phone, each pen is a card with its monthly values. Costs retain the organisation’s configured currency precision so that the table can be reconciled against the dashboard total.
Events recorded only against an individual animal, with no pen, do not appear in this table.
Recent Feeding Events
Section titled “Recent Feeding Events”This table shows the first 10 recent feeding events returned by the dashboard query.
| Column | Meaning |
|---|---|
| Date | Feeding occurrence in the selected farm’s timezone. |
| Type | The recorded feeding type. |
| Feed / Ration | Ration name when present; otherwise the direct feed-product name. |
| Qty (kg) | Recorded event quantity in kilograms. |
Select View all for the full event history, filters, recording controls and event details. If no event exists, the page prompts you to record the first feeding.
Ration adherence by pen
Section titled “Ration adherence by pen”The Ration adherence (last 30 days) section compares each pen’s plan with its plan-matched actual feeding across the inclusive 30-day window ending today.
The farm badge is the average of the pen adherence percentages for pens with a calculable plan. It is:
- green at 90% or above;
- amber from 75% to below 90%; and
- red below 75%.
For each pen, the table or mobile card shows the pen name, median animal count, planned kg, actual kg and adherence percentage. Actual quantity is net of recorded refusal. Both pen and farm percentages are capped at 100%.
Select a pen row to open Feed Variance with that pen, the same 30-day dates and the displayed animal count already supplied. Use the variance page to inspect ingredients, quantities and cost differences in detail.
If no plan covered any pen during the window, the section explains that a plan is required before adherence can be measured.
Feed Stock Forecast
Section titled “Feed Stock Forecast”The dashboard requests a 14-day stock forecast. The current calculation includes today and the preceding 14 farm-calendar days, then divides consumption by 14. This known calculation defect can make average daily consumption slightly high and estimated cover slightly short. Items with the fewest estimated days remaining appear first; items without a calculable forecast appear last.
| Column | Meaning |
|---|---|
| Feed Name | Catalogue product and its feed subcategory. |
| Current Stock | On-hand quantity in the catalogue item’s declared unit. |
| Avg Daily | Average recorded consumption normalized to kilograms per day over the forecast window. |
| Days Remaining | Estimated cover from normalized stock divided by average consumption. |
| Last Fed | Most recent matching feeding time in the farm’s timezone. |
| Reorder | Opens the Feed stock-receipt flow with this catalogue item preselected. |
The Days Remaining badge uses these dashboard bands:
- red: below 3 days;
- amber: 3 through 7 days;
- green: more than 7 days; and
- –: no usable forecast, for example no recent consumption or no valid conversion from the item’s stock unit to kilograms.
Reorder opens a receipt form; it does not create a purchase order or increase stock until the receipt is saved. It is disabled during read-only support access. Use the Inventory purchasing pages when the farm needs a supplier purchase order rather than an immediate receipt.
The forecast is a planning aid based on Farmlync records. Confirm physical stock, delivery lead time and expected ration changes before ordering.
Loading, refresh and partial errors
Section titled “Loading, refresh and partial errors”Dashboard sections load independently. Skeletons mark data that is still loading. If one or more overview requests fail, the page keeps successful sections visible and shows an error with Retry for the failed data instead of discarding the whole dashboard.
After recording a feeding event, the relevant cached dashboard data is refreshed. If a value still looks old, pull down to refresh or reopen the page before changing the record again.
Common checks when a figure looks wrong
Section titled “Common checks when a figure looks wrong”| Symptom | Check |
|---|---|
| Today’s progress is low | Confirm the feeding event date, pen and ration match the active plan. Review any off-plan quantity. |
| Cost is missing | Confirm the event’s feed or ration ingredients have usable costs and that an event was actually recorded in the selected period. |
| Adherence is over- or understated | Check the plan dates, pen membership, planned quantity, refusals and whether the event was plan-matched. |
| Stock cover is blank | Confirm recent consumption exists and that the catalogue unit can be converted to kilograms. |
| Stock cover is unexpectedly short | Compare physical stock, receipts and recent feeding quantities; the estimate uses recorded history, not future ration changes. |
| A card or section is absent | It may be intentionally hidden because there is no applicable plan, cost or pen-level data. Check the relevant specialist page. |
Continue with the detailed workflows
Section titled “Continue with the detailed workflows”- Set up feed and stock — configure feed products, nutrition and opening stock.
- Rations — build and manage recipes, quantities, dry matter and cost.
- Feed plans — assign rations to pens and control effective dates.
- Feeding events — record actual feeding, batch feeding and refusals.
- Feed variance — compare planned and actual ingredients, quantities and cost.
- Feed stock — inspect and manage feed inventory.