

Seasonal Breeding Report
What this page helps you do
Section titled “What this page helps you do”The Seasonal Breeding Report summarises a breeding block and its progress over time. Use its denominators and charts to assess submission and pregnancy patterns before changing a herd plan.
Open Breeding → Seasonal report. The report combines service outcomes, programme eligibility, pregnancy predictions and recorded calvings. It does not create or change breeding records.
You need View dashboard and analytics access for the selected farm. If Farmlync says that access is denied, ask a farm administrator to review your farm role rather than treating the page as an empty report.
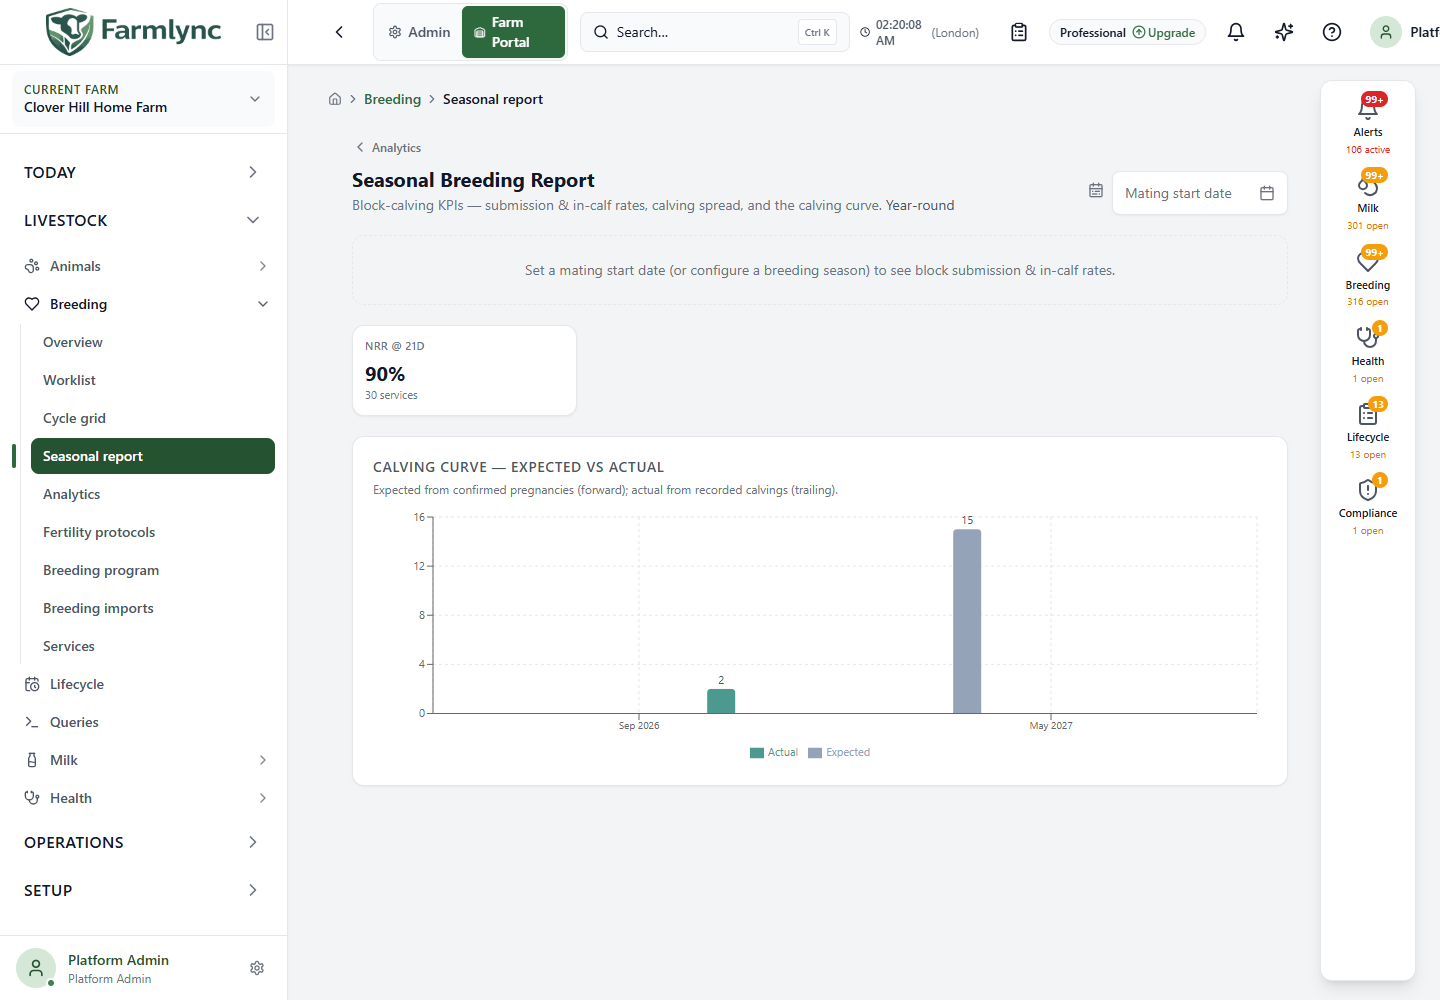
Choose the mating start
Section titled “Choose the mating start”Use Mating start date to choose the start of the block you want to examine. Changing it reruns the report; it does not save a new breeding-season setting. With the control empty, Farmlync uses the configured breeding-season start if one is available.
While the report is being calculated, the page shows a loading state. If the request fails, it shows an error message; retry after checking the selected farm and your connection. An invalid date is rejected rather than silently replaced.
The heading identifies the resolved calving pattern: Year-round, Spring block, Autumn block or Split block, and the effective mating start. If neither an entered date nor a configured start is available, the page asks you to set one before showing block submission and in-calf figures. Other sections can still appear.
Use Analytics at the top to return to the broader breeding analytics page.
Read the block summary
Section titled “Read the block summary”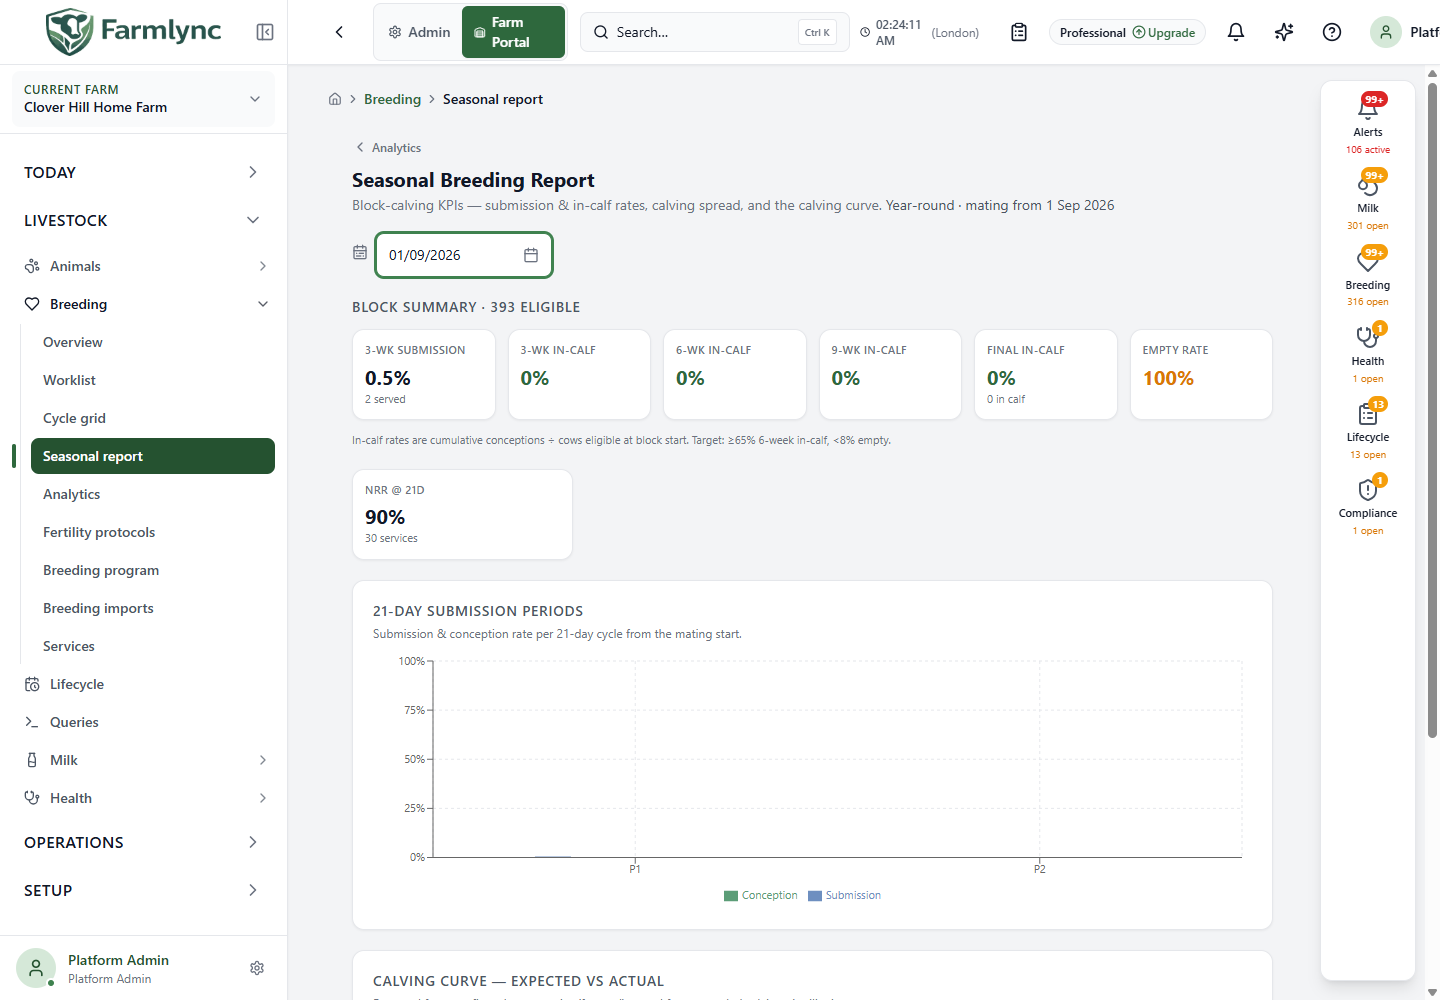
“Submission” means an eligible animal had at least one service in the period. It does not mean submitting a government form. “Conceived” comes from the recorded service outcome; a service that is still unresolved is not counted as a confirmed conception.
| Tile | Calculation and meaning |
|---|---|
| 3-wk submission | Animals served in the first 21-day period ÷ eligible animals for that period, as a percentage. The smaller count shows animals served. |
| 3-wk in-calf | Recorded conceptions in the first period ÷ the first period’s eligible count. |
| 6-wk in-calf | Recorded conceptions across the first two periods ÷ the same first-period eligible count. |
| 9-wk in-calf | Recorded conceptions across the first three periods ÷ the same first-period eligible count. |
| Final in-calf | Conceptions across all returned periods ÷ that first-period eligible count. “Final” covers the report’s available periods; it does not certify that an unfinished season has ended. |
| Empty rate | 100% minus the displayed final in-calf rate. It is not a count of independently examined empty animals. |
The report considers up to six 21-day periods from the mating start. A period is included once its start date has arrived; the latest period may still be incomplete. Its eligibility test looks through that period’s end, so animals that become eligible later in the current period can already enter its denominator. Missing services and outcomes can therefore change the figures later.
Understand the eligible population
Section titled “Understand the eligible population”The calculation starts from currently active females enrolled in the breeding programme and not recorded with a breeding hold. For each period, calved animals must clear their effective VWP by that period’s end; qualifying maiden heifers use breeding-age eligibility. Animals already recorded as conceived before a period starts are removed from that period’s submission denominator.
The summary’s eligible count is the first period’s calculated population, not a preserved census taken on the first morning of the season. Later periods can have different eligibility as animals become eligible or conceive. Historical reports can also change when programme membership or source records change. Interpret the block summary alongside the period chart; do not treat it as a permanently fixed cohort audit.
A dash means the calculation lacks a valid denominator; it does not mean zero performance. The screen’s 65% six-week in-calf and under-8% empty figures are displayed reference targets, not automatic pass/fail decisions for your farm.
NRR @ 21d
Section titled “NRR @ 21d”NRR is the non-return rate. Farmlync looks at qualifying services in the preceding 365 days that are old enough for the full observation window. It counts a return when another heat or service is recorded 18–24 days later.
NRR = services with no recorded return in that window ÷ qualifying services × 100.
The smaller number shows qualifying services, not unique animals. This measure is separate from the selected seasonal block. No recorded return does not confirm pregnancy: missing heat observations can raise NRR without improving conception.
Chart: 21-day submission periods
Section titled “Chart: 21-day submission periods”The horizontal axis shows P1, P2 and later 21-day periods starting at the selected mating date. The vertical axis is a percentage from 0 to 100.
| Bar | What its height means |
|---|---|
| Submission (blue) | Animals served at least once in that period ÷ animals eligible for that period. |
| Conception (green) | Animals with a conceived service in that period ÷ animals submitted in that period. |
Hover over the bars to see the reported percentages. The two bars have different denominators. A high conception bar with a low submission bar can mean good recorded results among a small served group, while many eligible animals were not served. Repeated services for one animal within a period do not count as several submitted animals.
Calving spread
Section titled “Calving spread”This section describes recorded calvings in the window associated with the selected mating block. It appears only when there are at least five qualifying calvings. The window is based on mating start plus configured gestation, widened for early/late calvings and the block length; it is not restricted to a saved list of mothers served in that block.
| Figure | Meaning |
|---|---|
| Total calvings | Calving records included in the window. |
| Spread days | Days between the first and last included calving. |
| P25 | Approximately how many days after the first calving it took to reach one quarter of the included calvings. |
| Median | The corresponding halfway point. |
| P75 / P90 | The three-quarter and nine-tenths points. These are interpolated and rounded whole-day measures. |
| In 3 weeks | Percentage with dates no more than 21 days after the first included calving. |
| In 6 weeks | Percentage no more than 42 days after the first included calving. |
All elapsed days start from the first actual included calving, not directly from mating start. For example, Median 20d means half the included calvings were reached around 20 days after the first one; it does not mean gestation lasted 20 days.
Chart: Calving curve — expected vs actual
Section titled “Chart: Calving curve — expected vs actual”The horizontal axis shows calendar months and the vertical axis shows counts. Expected bars use current pregnancy-based predictions looking forward; Actual bars use recorded calvings looking back. The screen uses its default 12-month windows and omits months with no expected or actual entries.
Use hover values and the legend to distinguish the two series. This is a workload-planning picture combining current expectations and past events. It is not a frozen forecast-versus-outcome accuracy report: a past expected value has not been preserved for comparison after the pregnancy becomes a recorded calving.
If a figure looks wrong
Section titled “If a figure looks wrong”Check the mating date, farm reproductive settings, programme membership, holds, calving dates, services and service outcomes. A blank section can mean insufficient data; a request error says the report could not load and should not be interpreted as an empty herd. Correct source records through their normal forms, then reopen the report.